Here's the link to click/tap on for the world-wide tracker:
And here's the link to use for the UK-only COVID-19 tracker:
The underlying data is from the same source, but the idea here is that web licensees of the CSS engine can set up themes and geographical focus for embedding into their own sites. This being AAWP and being based in the UK, having a UK-centric 'view' seemed appropriate.
[NOTE: at the time of writing, understandably, this online database is under very heavy load, so be patient. And you might have to try reloading the page(s) at a quieter time of day.]
But first the world view:
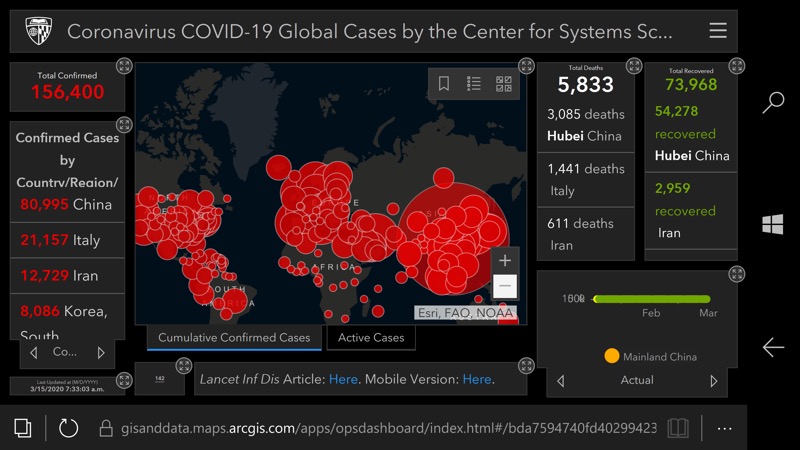
The 'Desktop' view, best seen in landscape, though it's very slow to load because of all the code behind the view. My link above should take you to the 'Mobile' view, seen below:
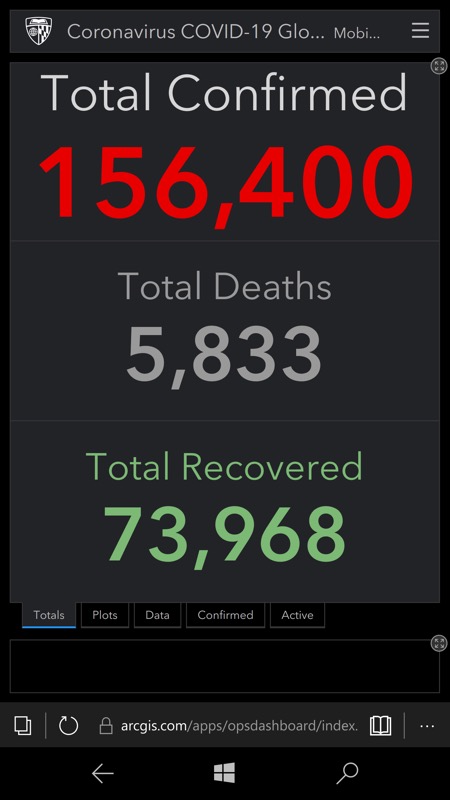
Big, bold (and worrying) numbers, see the swipeable tabs along the bottom
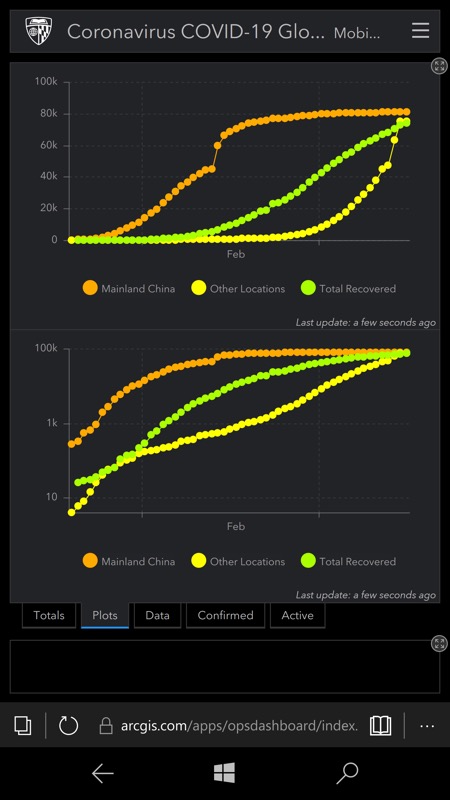
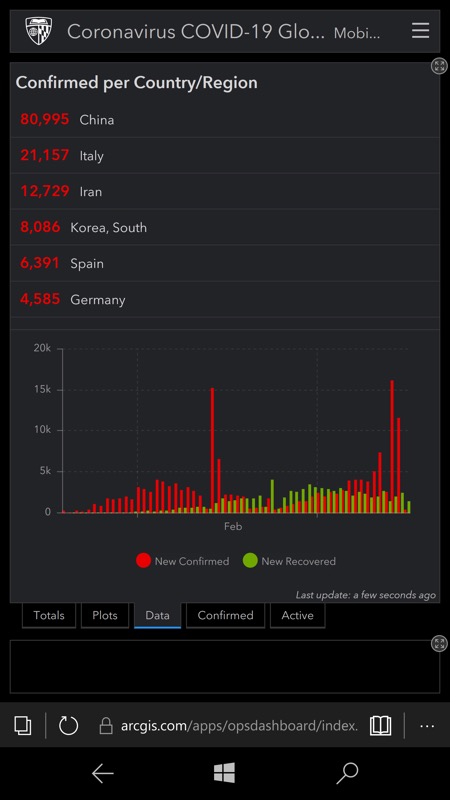
These lead to other helpful mobile-friendly views of the real time data, here showing tracking over time and by country...
And then the UK view of the data, first seen on the BBC site:
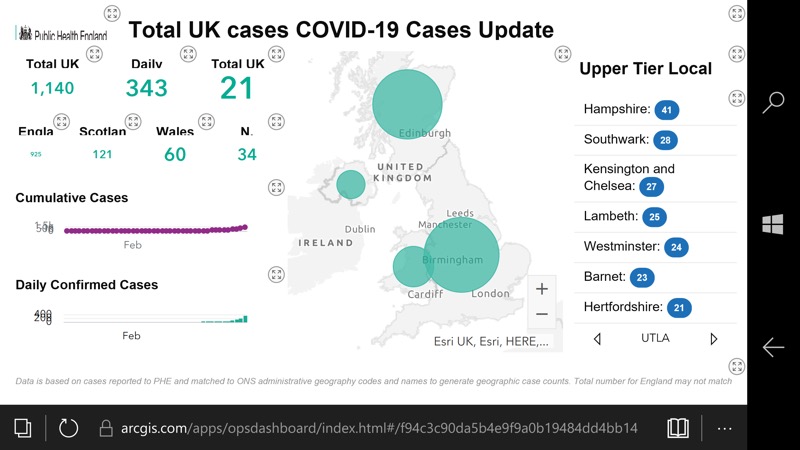
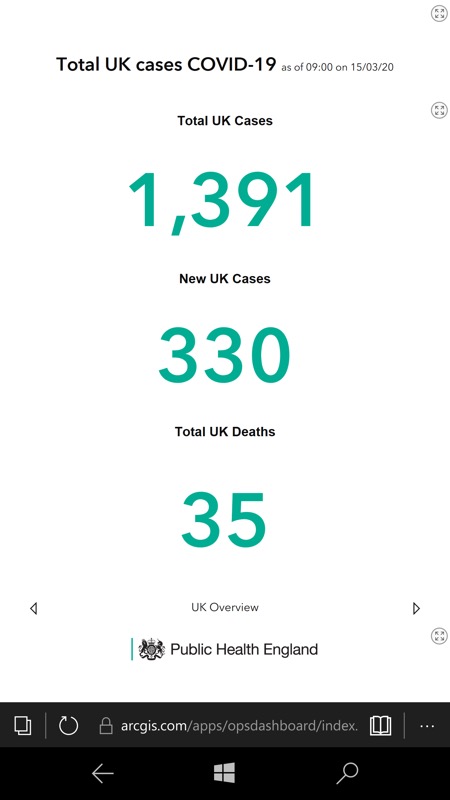
Firstly, there's a Desktop version, which I wouldn't recommend - again, it's too much for the smaller screen and limited processing power of an old Lumia. And then (right) there's the 'Mobile' version, which is the one I linked to above, which presents each set of stats on their own pages.
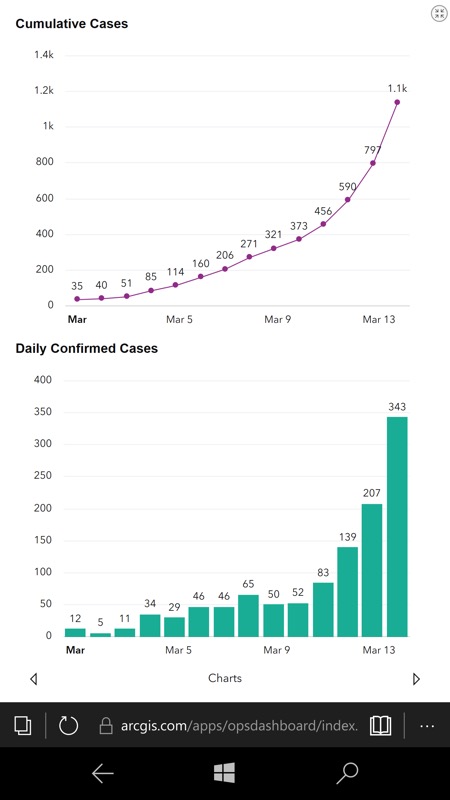
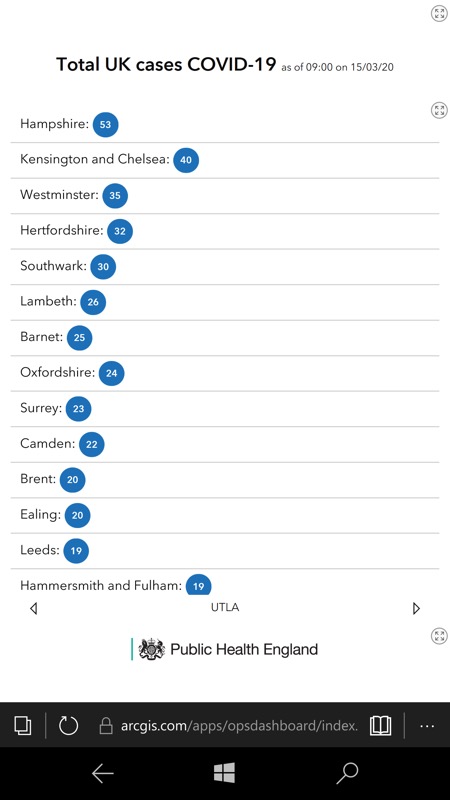
For example, here are breakdown of COVID-19 cases by cumulative count and daily additions; (right) and here's the breakdown by UK council area, the panes are swipeable, as needed, of course.
All very handy to have on the phone, then. Even if it runs Windows 10 Mobile and the Edge browser.
