Here's the headline slide from the blog entry:
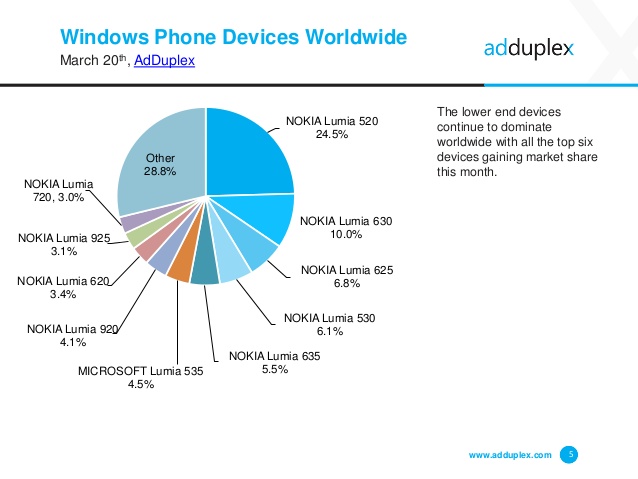
AdDuplex says: "This report is based on data collected from 5,265 Windows Phone apps running AdDuplex SDK v.2. The raw data analyzed was collected over the day of March 20th, 2015 (UTC time)"
Now, right up front, I should add that the stats above look roughly right - but only roughly, and I suspect there's a skew that isn't evident to the casual reader.
For starters, there are the obvious caveats:
- The applications analysed for advert display were only just over 0.1% of the entire Windows Phone app library, meaning that 99.9% (ish) of applications being used weren't being detected at all.
- What's being measured here is use rather than sales, i.e. installed base, a subtle point, but obvious if you think about it from the dominance of the now very old Lumia 520.
- The data was just from one day - one presumes that a day is enough, but I'd have thought that a week's worth would be more reliable?
- The 'Other' section of the pie chart is very large, at 28.8%, larger even than the top entry, so there are clearly a lot of devices 'bubbling under'.
But then there's the real kicker, which takes some lateral thinking. At first glance, the chart appears to show the proportions of Windows Phones in use - as I say 'installed base'. And it's along the right lines. But it's only counting users running applications which happen to have a specific ad network's code included.
What about:
- people just using the built-in Windows Phone app set (PIM, Office, HERE, Xbox, and so on)
- the large number of totally free applications
- the sizeable and well thought of set of commercial applications (think Podcast Lounge, Tweetium, Aeries, Nextgen Reader, and so on)
- all the apps and games which use a rival ad network
- people upgrading apps and games that use AdDuplex code using in-app purchases to remove ads for all future use
I contend - and I accept that it's just a contention, I have no more proof than AdDuplex here - that their relatively tiny and specific sampling of ad-supported applications, while giving a good flavour of part of the market, is skewed quite heavily towards users who are content with ad-supported applications, i.e. who don't have the funds to pay to dismiss ads or who don't know better in terms of finding alternative applications.
Looking at my own phones, I have almost NO ad-supported applications installed - if I like an app that much, I pay for the 'pro' version or pay in-app to get rid of the apps, which simply get in the way. However, looking at my 10 year old nephew's Lumia 630, there are ads in every single game and in every third party application. Something of a personal observation then, but I did check via Twitter opinions, and it seems as if there's an extremely clear correlation between limited means and the use of ad-supported apps. The logical conclusion is that these users will be those buying the cheapest and lowest end phones, as borne out in spades by AdDuplex's chart.
However, the highest end Lumia in the chart is the classic 920, at 4.1% and there's no mention whatsoever of the 1520 or 1020, and so on. Now, I don't pretend that the chart should be the other way around, I do agree that the low end will naturally dominate - after all, the cheaper something is, the more units will be sold. But I do contend that there's a slight skew in AdDuplex's stats too much in favour of the low end.
Just a guess, but I'd estimate that a truer installed base breakdown would be:
- Lumia 520 - 22%
- Lumia 630 - 8%
- Lumia 625 - 6%
- Lumia 920 - 6%
- Lumia 530 - 5%
- Lumia 635 - 4%
- Lumia 925 - 4%
- Lumia 535 - 4%
- Lumia 1020 - 4%
- Lumia 620 - 3%
- Lumia 720 - 3%
- Lumia 1520 - 2%
- Others - 29%
As I say, a pure guess, but I do see as many 920s and 1020s around in Reading, UK, as 635s and 630s. I do wish Microsoft would break all this down officially.
Your comments welcome, though of course AAWP itself will have its own natural skew, towards enthusiasts and 'power users'. Gah. Lies, damn lies and statistics, eh?